Souhaila_Serbout
31 october 2023
We propose two colorful simple visualizations to depict API evolution: API Version Clock and API Changes.
-
The API Version Clock visualization classifies all changes based on their impact on clients and captures them in chronological order while putting them in relationships with the different API versions.
-
The API Changes visualization provides a precise localization and analysis of modifications within the API description structure. This visualization aids in understanding the stability of specific API elements and fine-grained evolution patterns of the API design.
The integration of both visualizations provide a holistic view of the API’s evolution journey, supporting the analysis of versioning practices and the localization of breaking and non-breaking changes on the API structure and data model.
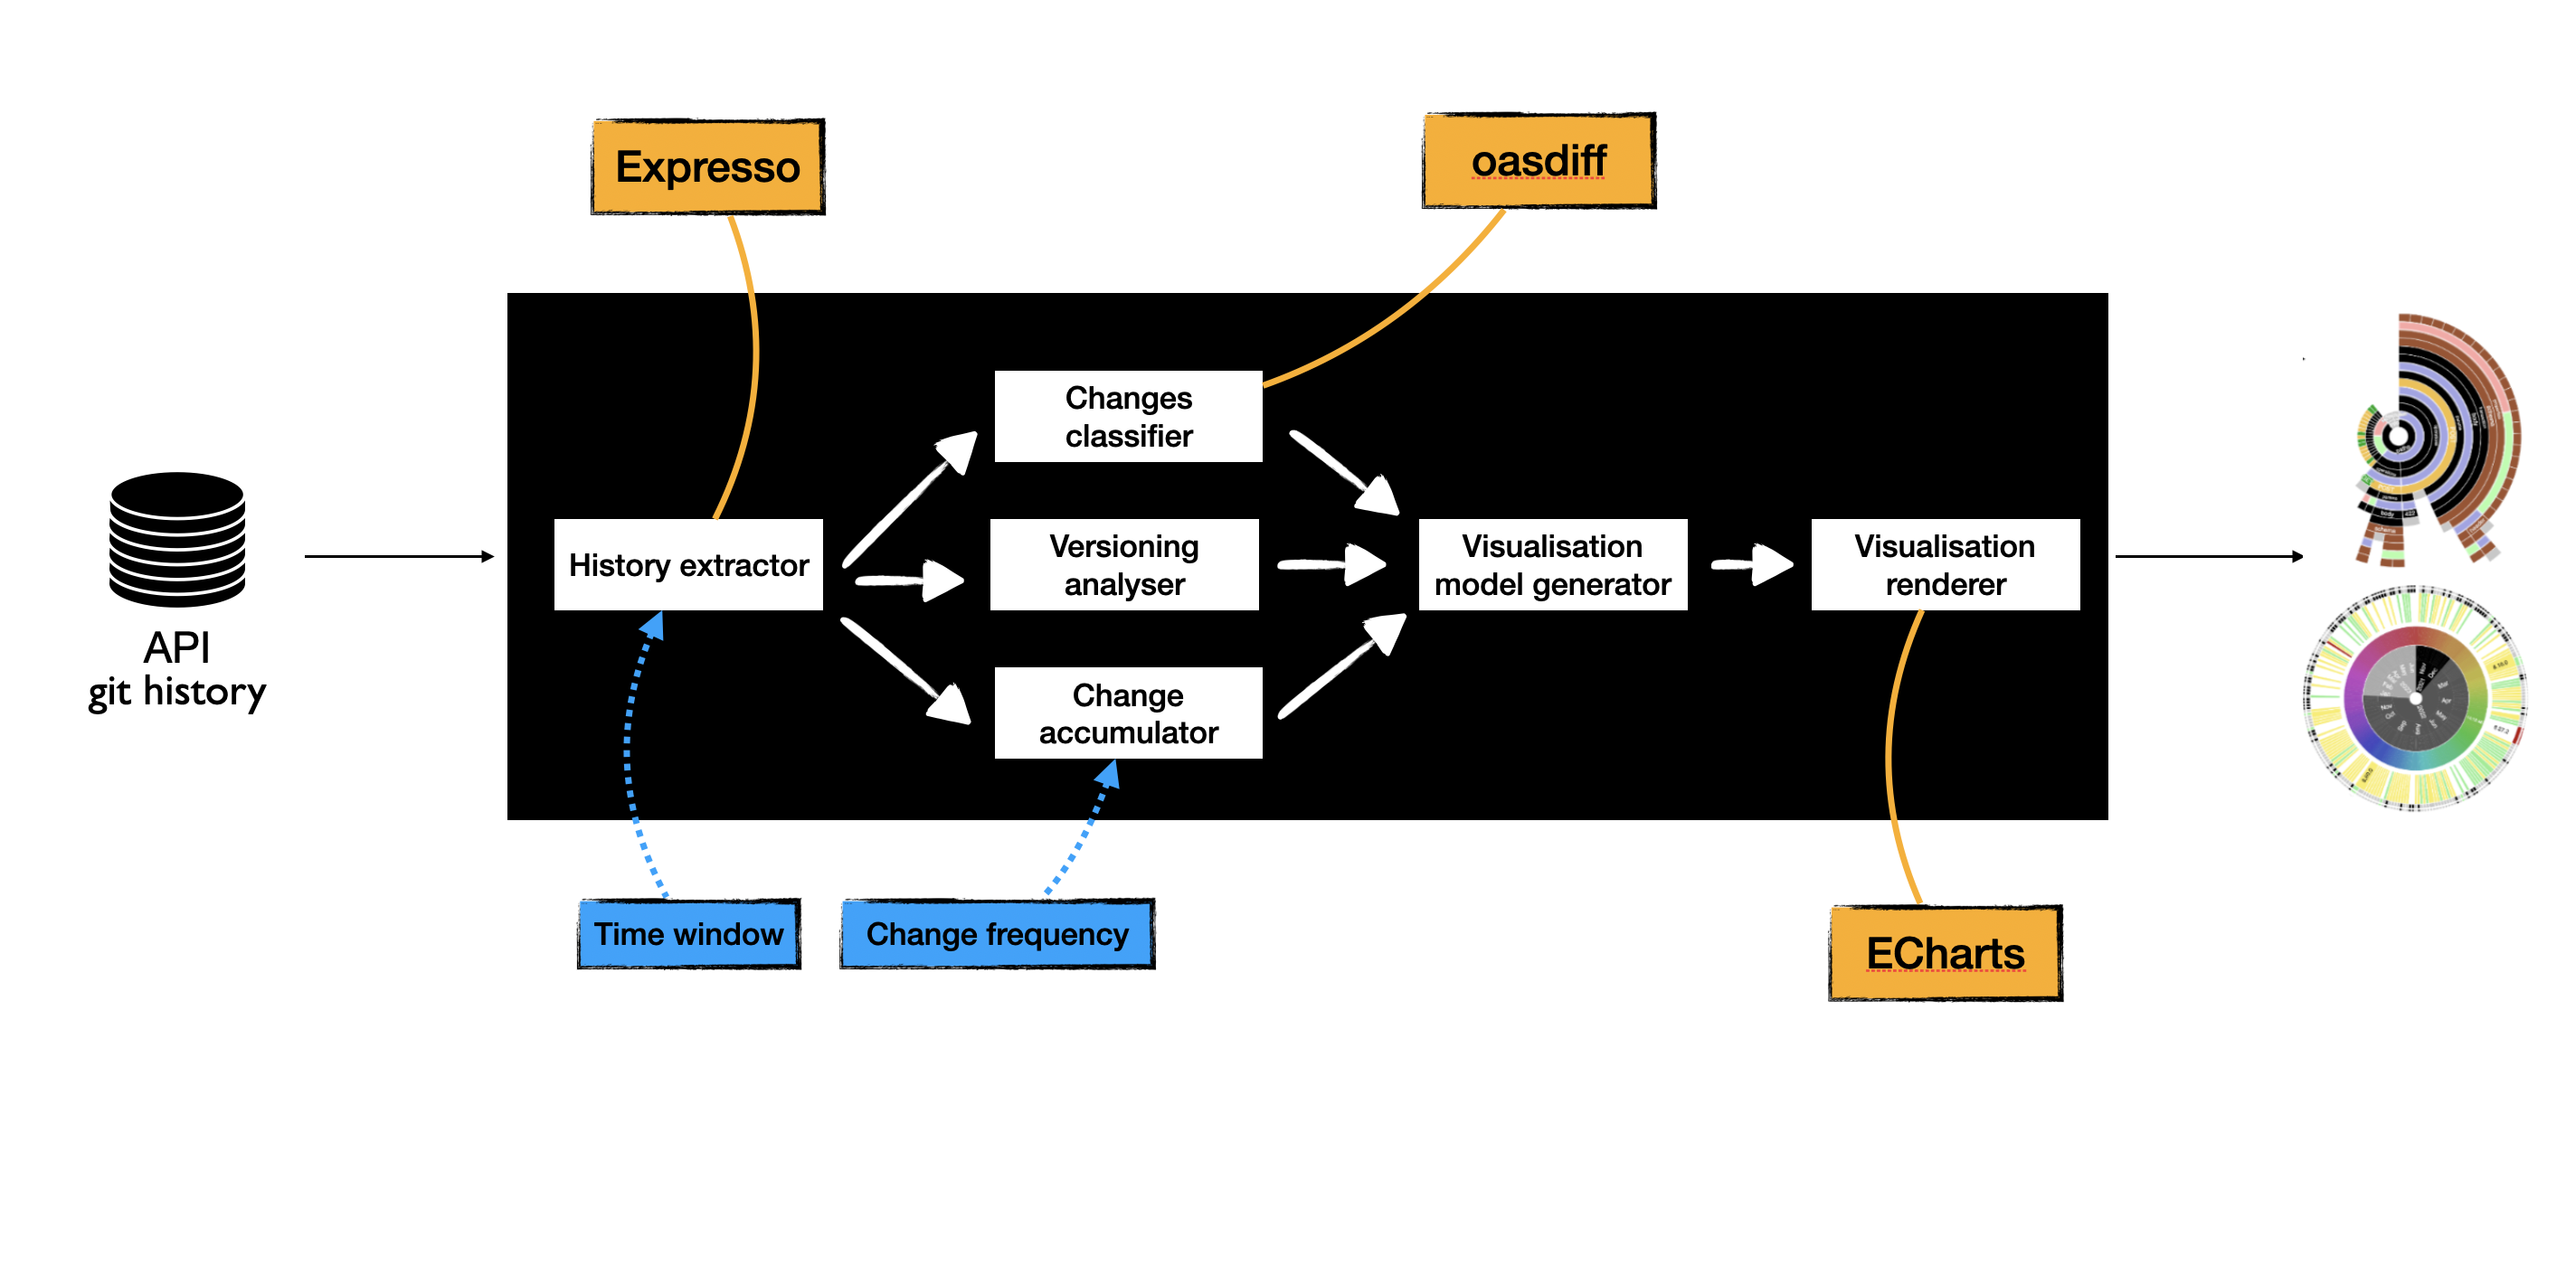
Both visualizations can be automatically generated using a CLI we made available as an NPM module called APIcture: https://www.npmjs.com/package/apict
The tool analyses the git history of a given API repository that contains and OpenAPI description of the API or with a backend code using ExpressJS. In the case of an ExpressJS backend that has not OpenAPI specification, the tool will generate an OpenAPI description of the API corresponding to each commit and then proceed with the analysis. Using the CLI, the use can specify the time window the the history of the API to be analyzed.
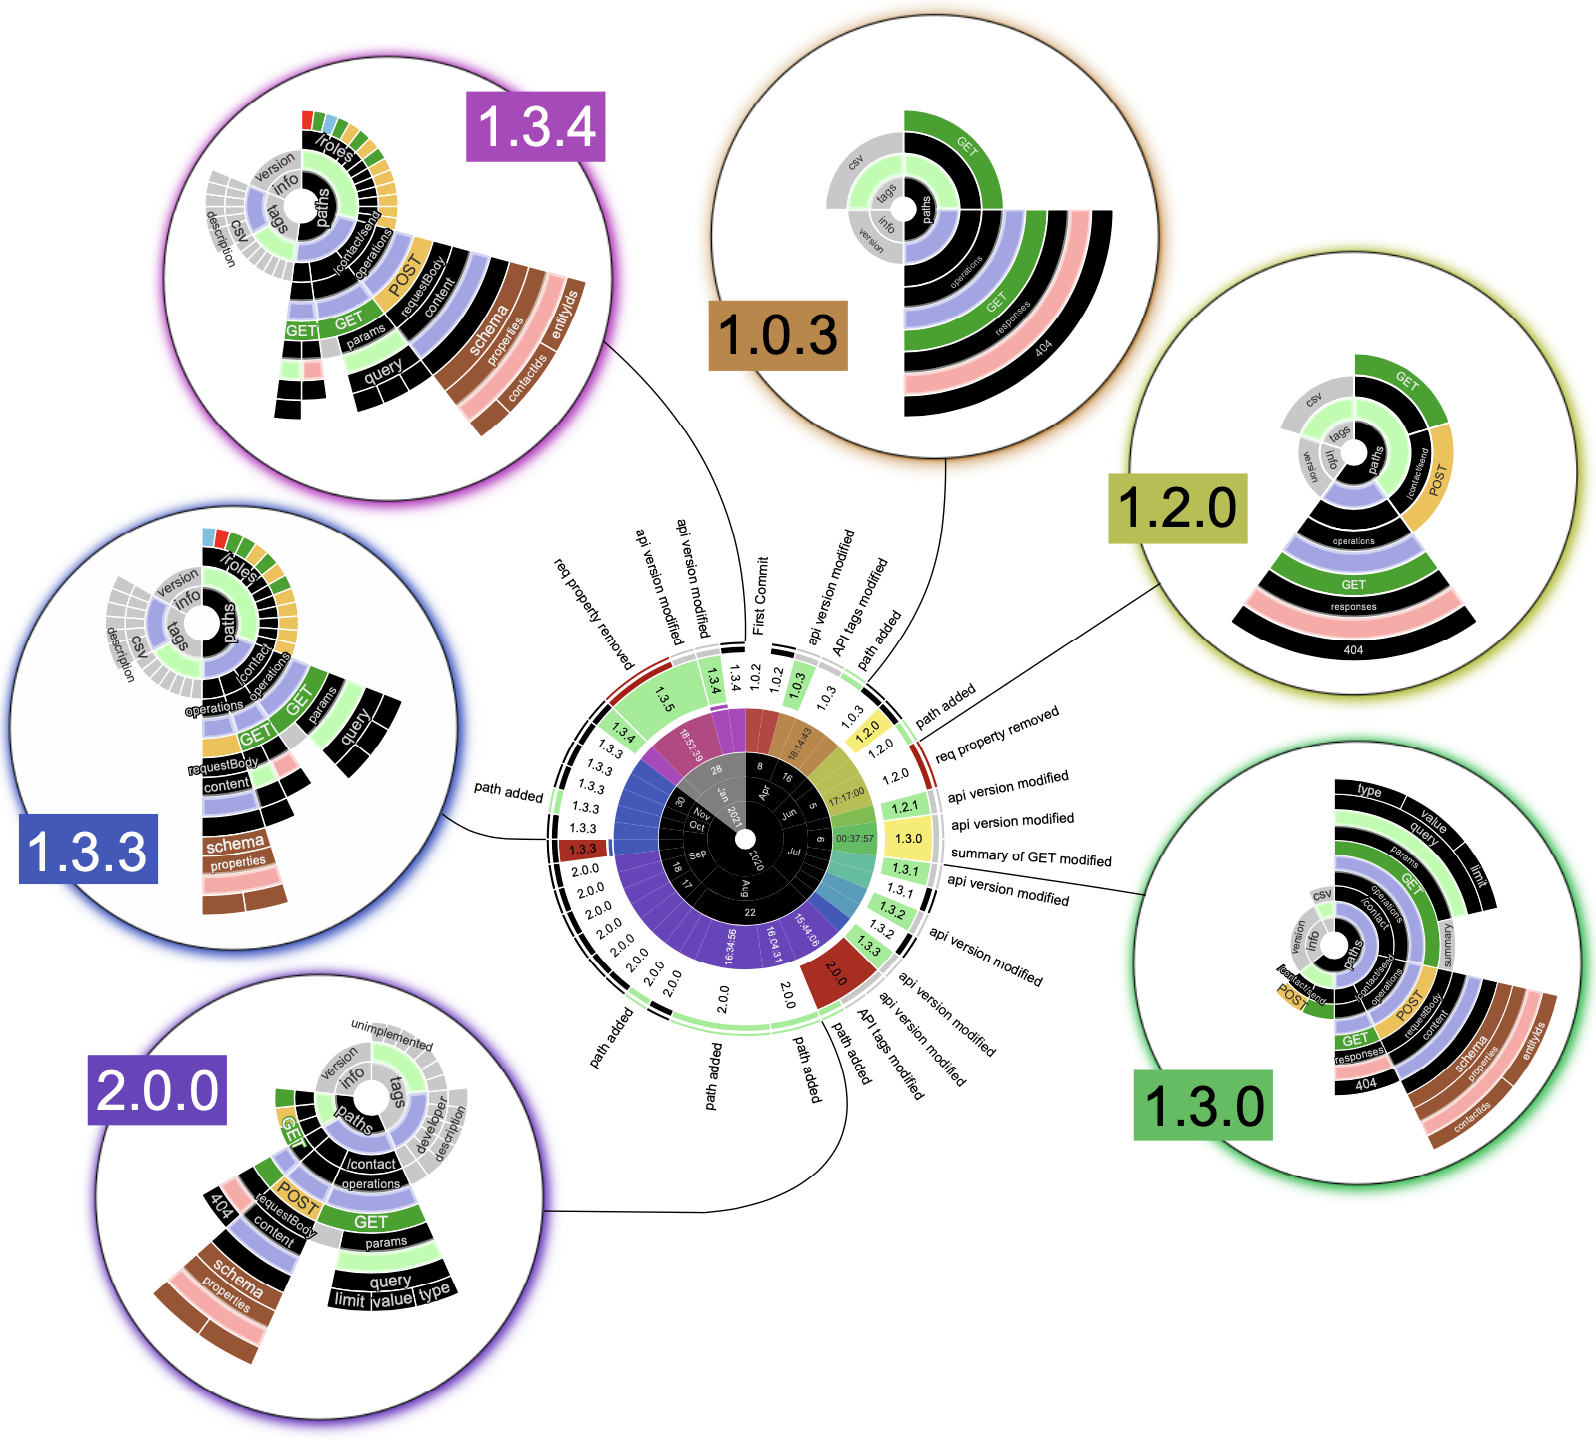
API Version Clock
This visualization serves as an evolutionary clock, providing a visual representation of the different types of changes that occur during a specific timeframe in an API’s history
The primary objective of API Version Clock is to assess the congruence between version identifier updates and the relative significance of breaking and non-breaking changes introduced in the API over time. Developers can leverage this visualization to gain insights into the adopted versioning strategy for a specific API and evaluate its adherence to the principles of semantic versioning.
Let’s take a look at the API Version Clock of the OpenAI API.
The API has seen a total of 61 commits, spread across six unique versions, signifying a history of active development and improvement.
API Meta data
API Commits and Versions
| Unique Versions | 6 |
|---|---|
| API Total Commits | 61 |
| API First commit | 2022-01-19 09:44:49 -0800 |
| API Last Commit | 2023-10-19 11:40:50 -0500 |
API Changes
The purpose of this visualization is to provide a clear understanding of the location of the changes occurring in the API structure, its data model as well as related metadata information. By visually representing the deletions, additions, and modifications happening at the level of metadata, structural and data model elements, it becomes easier to localize the frequently occurring changes and comprehend the overall stability of the API design.
One important aspect to highlight is that the changes visualization does not indicate when each change occurred. This deliberate omission contributes to the scalability of the visualization, as it allows for the accumulated changes across multiple API versions and commits within a specific timeframe to be captured in one visualization. This approach simplifies the visualization process and enables a more efficient analysis, particularly when dealing with APIs with long histories or many fine-grained granular changes applied to it.
A gallery of real-world API histories visualizations can be found here.