Interactively Exploring API Changes and Versioning Consistency
This paper introduces APIcture, an innovative visualization approach for understanding Web API evolution. We developed two complementary visualization techniques that help developers, researchers, and API consumers understand how APIs change over time.
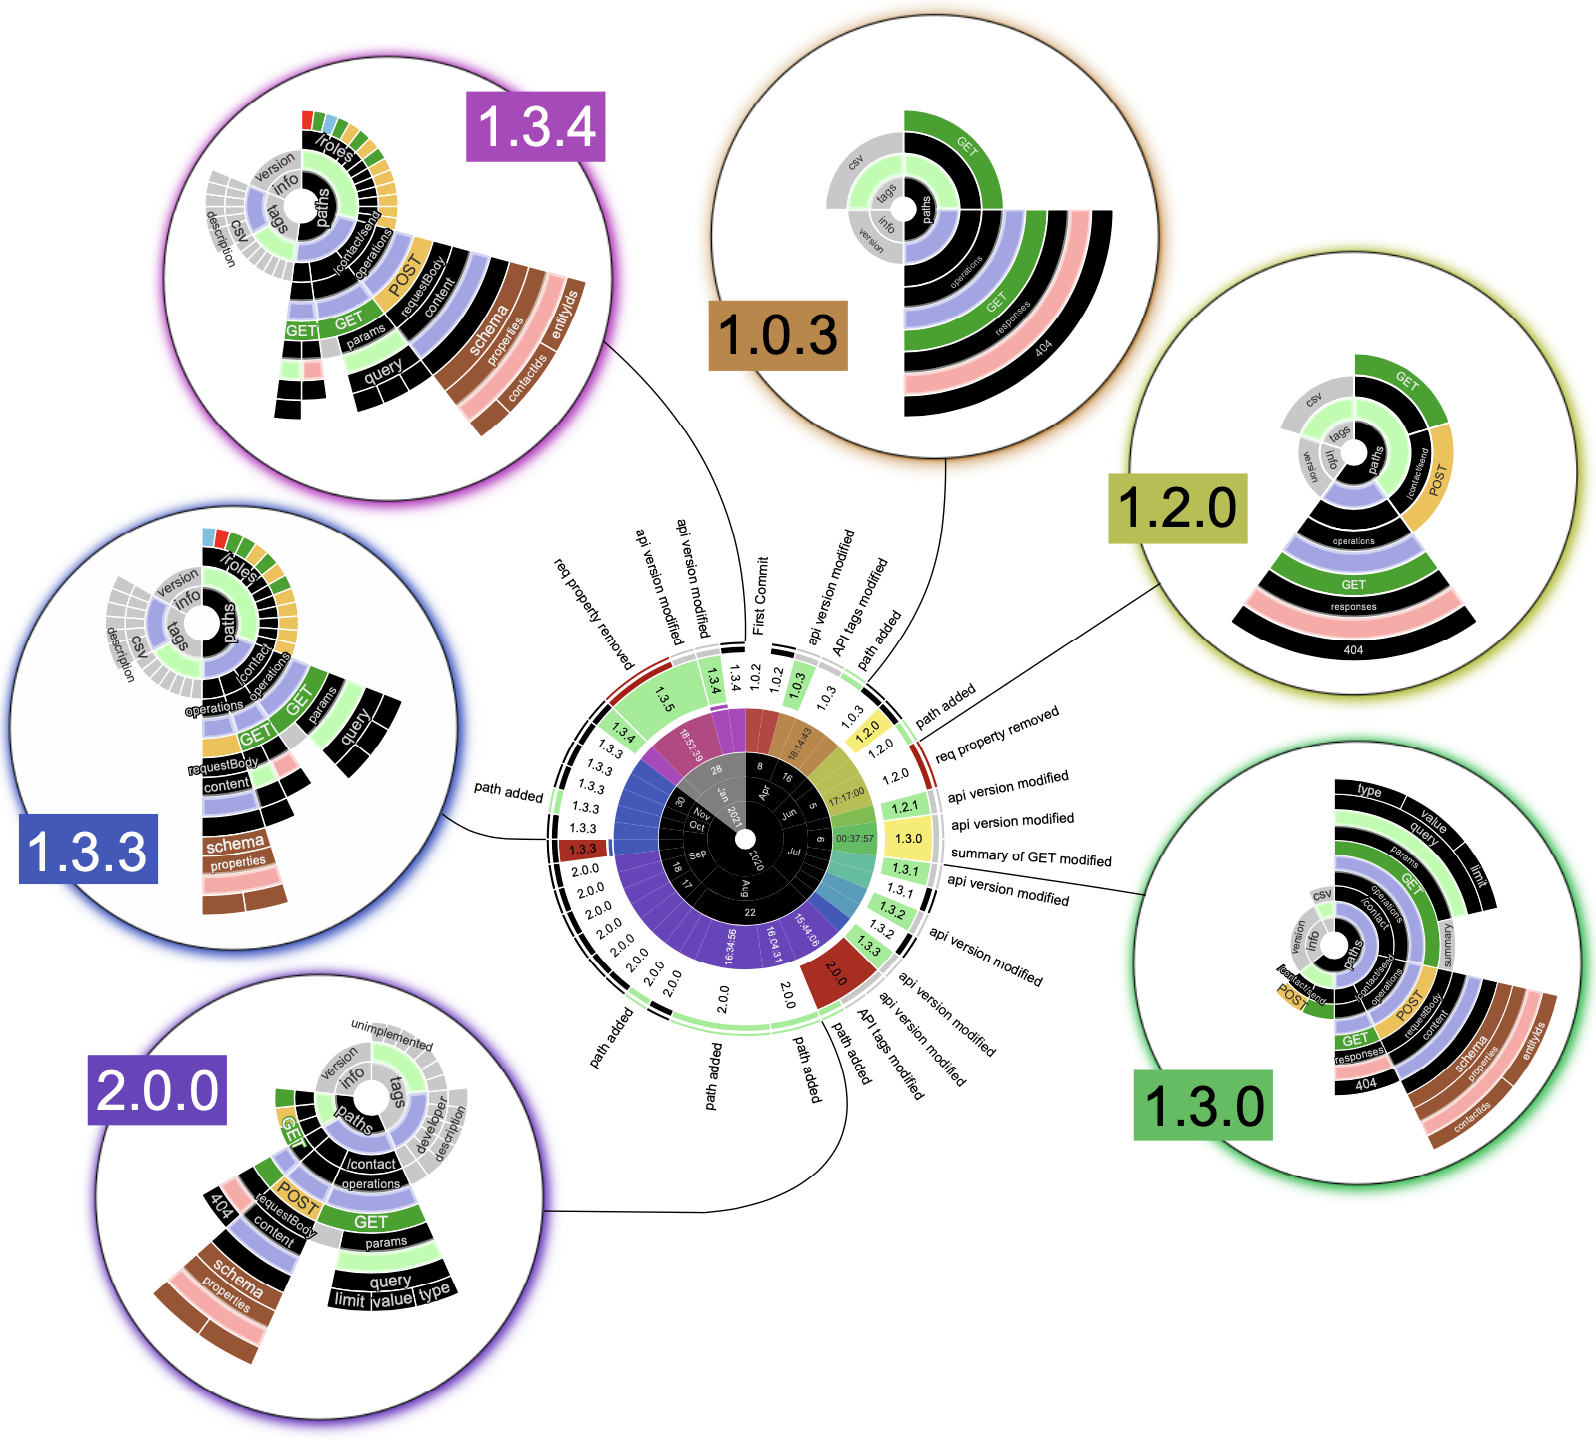
The first visualization shows detailed changes occurring at specific time intervals, helping users understand the evolution patterns of Web APIs. This temporal view reveals:
The second visualization provides an overarching view of version upgrades and change patterns using a clock metaphor. This circular representation helps identify:
APIcture empowers researchers, developers, and users to gain deeper insights into the evolution of web APIs. The tool enables users to comprehend the temporal sequence of changes, assess compatibility issues, and understand versioning practices across different APIs.
Our evaluation demonstrates that APIcture effectively reveals API evolution patterns that are difficult to discern through traditional textual comparisons or simple diff tools.